At WiseGEEK, we're committed to delivering accurate, trustworthy information. Our expert-authored content is rigorously fact-checked and sourced from credible authorities. Discover how we uphold the highest standards in providing you with reliable knowledge.
What is the Aggregate Demand Curve?
The aggregate demand curve is a macroeconomic concept that summarizes the total demand for all goods or services in an economy. This concept typically focuses on finished goods, since consumers primarily purchase these items in the economic market. Aggregate demand can also represent the total of all individual demand curves, which play an integral role in the supply and demand theory.
Supply and demand is a basic economic theory that attempts to find the equilibrium price point where total supply of goods and services by producers will equal the total demand for goods and services by consumers. This economic concept is displayed on a graphical right-angle chart, with the vertical axis representing product prices and the horizontal axis containing information on total number of goods or services a company will sell at different price points. The demand curve starts at the upper left corner and slopes down to the lower right of the chart. The supply curve starts at the graph’s upper right corner and slopes downward toward the lower left of the chart. The intersection point represents an equilibrium point. This chart represents supply and demand at the microeconomic, or single product, level.

The aggregate demand curve helps countries measure their gross domestic product (GDP) by using a calculation such as the consumer price index (CPI). The consumer price index is an average price of goods or services commonly used by households. Because the aggregate demand curve represents an “average” demand for all goods based on GDP, the CPI is an average price to represent information on the vertical axis of the aggregate supply and demand graph. In short, the CPI calculates a weighted-average price for goods such as food, housing, clothing, and similar necessary expenditures. Higher average prices for these goods will move the equilibrium point higher on the aggregate demand curve, indicating fewer goods will be sold in the overall economic market.

Rather than movements up and down the aggregate demand curve in relation to the average consumer index, the entire demand curve may shift left or right on the supply and demand graph. This occurs when customer preferences for goods or services change, substitute goods or services enter the market that offer better value for consumers, or increases occur in overall consumer income. Monetary and fiscal policy can play a significant role in shifting the aggregate demand curve. Higher taxes and inflation can shift the entire curve to the left, decreasing the total demand in an economy based on lower income. The opposite will occur in light of lower taxes and inflation, which will shift the demand curve to the right.
AS FEATURED ON:
AS FEATURED ON:

-
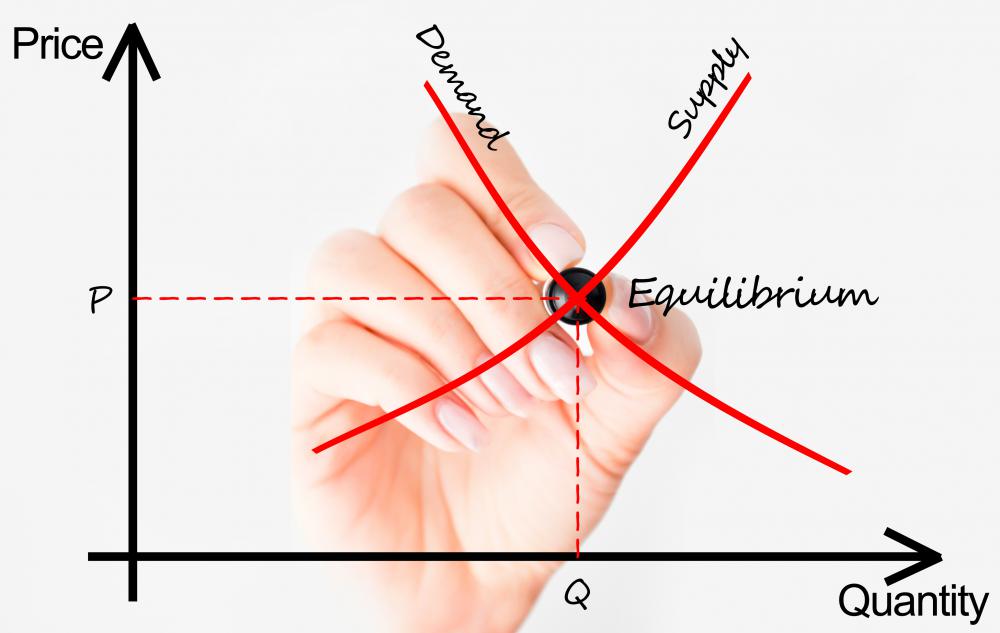
![The aggregate demand curve can represent the total of all demand curves.]() By: adrian_ilie825The aggregate demand curve can represent the total of all demand curves.
By: adrian_ilie825The aggregate demand curve can represent the total of all demand curves. -
![The aggregate demand curve is a macroeconomic concept that summarizes the total demand for all goods or services in an economy.]() By: Andres RodriguezThe aggregate demand curve is a macroeconomic concept that summarizes the total demand for all goods or services in an economy.
By: Andres RodriguezThe aggregate demand curve is a macroeconomic concept that summarizes the total demand for all goods or services in an economy.

Discuss this Article
Post your comments