At WiseGEEK, we're committed to delivering accurate, trustworthy information. Our expert-authored content is rigorously fact-checked and sourced from credible authorities. Discover how we uphold the highest standards in providing you with reliable knowledge.
What is a Control Chart?
A control chart is a statistical measurement tool companies use to determine the effectiveness of their manufacturing or production processes. This chart usually lists a high-low range of production output for each process measured. Managers often use this statistical tool as a quality-control method to analyze and understand variables in production processes, determine the highest amount of output possible and review the issues creating differences between the target output and actual output. The control chart may include a trend or average line drawn in that represents the minimum level of production output that is acceptable for the business process.
Control charts may be used for various departments or production processes in a company. Breaking down each production process using the control chart statistical method analysis can help companies understand the effectiveness of each individual operation that makes up an overall business process. Individual charts can also help managers discover any problems or errors in specific production processes so these items can be corrected to improve the overall production output for the company.

An important part of using a control chart analysis is plotting previous production numbers on the chart for comparison and review by management. Once the company has created individual control charts for each production process and drawn the trend line that represents the average or minimum accepted level of production for each process, the company must then plot previous production numbers on the chart to determine if any variances have occurred. Plotting previous production numbers on the control chart is how companies determine how well their production processes meet the company’s expected level of output. Data points may be plotted on the control chart for a daily or monthly time period, depending on the production process of the company.
Plotting production output on the control chart allows companies to see where major drop offs or large increases have occurred during normal production operations. While companies may be concerned that the data points do not fall closely in line with their minimum accepted production output, data points that fall outside of the high-low range are considered a major concern. Data points falling below the minimum accepted range may indicate significant production problems, such as equipment failure, not enough employees or limited economic resources available for production. Data points falling outside the high range of the control chart may indicate the company was catching up from previous low periods or received more orders than it can produce in a timely manner. Consistently high data points above the high a range may also indicate that the company is unable to meet its quality control standards when producing consumer goods in large, unexpected volumes.
AS FEATURED ON:
AS FEATURED ON:

-
![Companies use control charts to determine the effectiveness of their manufacturing processes.]() By: ã«ã·ã¹Companies use control charts to determine the effectiveness of their manufacturing processes.
By: ã«ã·ã¹Companies use control charts to determine the effectiveness of their manufacturing processes. -
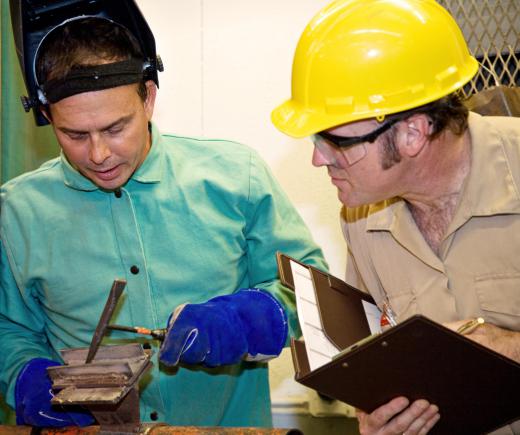
![Managers often use control charts as a quality control method to understand production variables.]() By: Lisa F. YoungManagers often use control charts as a quality control method to understand production variables.
By: Lisa F. YoungManagers often use control charts as a quality control method to understand production variables.


Discuss this Article
Post your comments