At WiseGEEK, we're committed to delivering accurate, trustworthy information. Our expert-authored content is rigorously fact-checked and sourced from credible authorities. Discover how we uphold the highest standards in providing you with reliable knowledge.
What Are the Different Aggregate Demand Models?
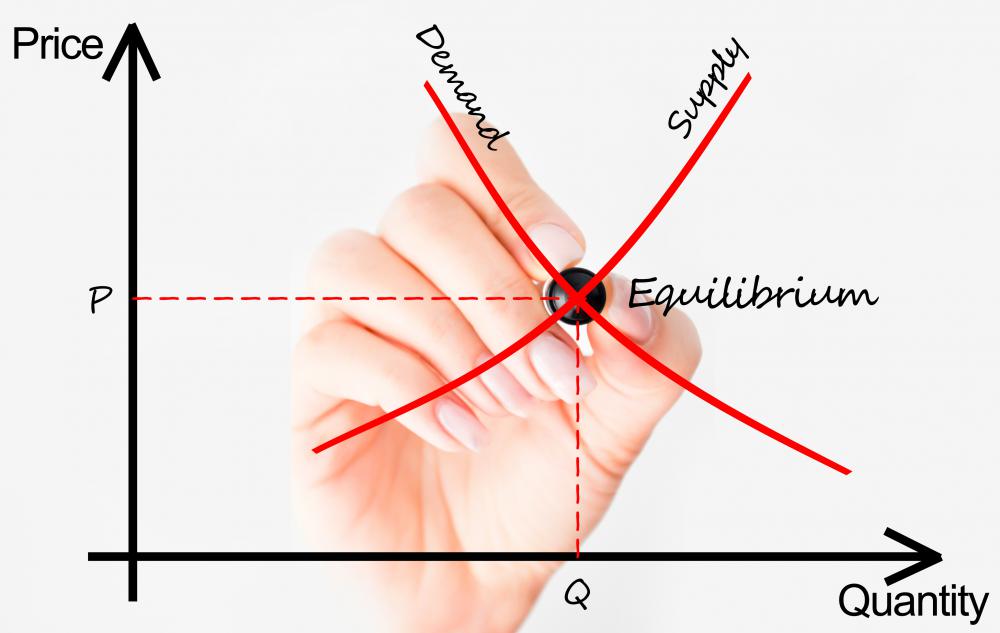
"Aggregate demand" is a term that is used in macroeconomics to describe an economy’s total amount of demanded and supplied goods and services for a given time period. Macroeconomic analysts might refer to aggregate demand as total spending for the given time period. Aggregate demand and aggregate expenditure are the two types of aggregate demand models. These mathematical models are most often depicted as curves on supply and demand charts.
A country’s aggregate demand is often discussed in conjunction with its gross domestic product (GDP) because the two models have an inverse relationship. Prices increase when aggregate demand rises, which decreases the GDP. This relationship creates the curve that is typical of aggregate demand models.

An economy falls somewhere on the aggregate demand curve. Economies that are lower on the curve have lower-priced goods and services but higher GDP. The opposite is also true. High GDP usually is a good thing, but the lower aggregate demand doesn’t always indicate a healthier economy, it just means that people are paying less for goods and services, rent and other living expenses. Sometimes, lower aggregate demand indicates lower wages.
The inverse relationship with GDP isn’t the only reason that aggregate demand models curve downward. Another reason is the cost of money, or the interest rate. Low aggregate demand and high GDP mean “cheep” money with low interest rates. Consumers have to spend less money for the same goods.
Inflation is the opposite situation, with consumers spending more money for the same goods. Economies with inflation issues can be found further up the aggregate demand curve. They have high aggregate demand and low GDP.
One of the aggregate demand models is aggregate expenditure. This model uses some of the basic principles of aggregate demand but focuses on the total amount spent to produce goods and services that were consumed, instead of the amount consumers spent on the goods and services. The curve in this chart comes from comparing the investment to expected rate of return as calculated from the original aggregate demand curve.
Aggregate expenditure models differ from other aggregate demand models because the model doesn’t always create a curve when compared with the GDP. Often, aggregate expenditure creates a straight line when compared with the GDP. This is because financiers might base investments on the perceived health of the current economy, which could be determined by GDP numbers.
Investors and business owners sometimes use aggregate expenditure and aggregate demand models to decide when to start projects. They also might use them to predict how much capital to spend on current projects. Ideally, owners and investors want to create products when production is inexpensive and sell products when prices are higher.
AS FEATURED ON:
AS FEATURED ON:

-
![Aggregate demand models are commonly depicted as curves on supply and demand charts.]() By: adrian_ilie825Aggregate demand models are commonly depicted as curves on supply and demand charts.
By: adrian_ilie825Aggregate demand models are commonly depicted as curves on supply and demand charts.
Discuss this Article
Post your comments