At WiseGEEK, we're committed to delivering accurate, trustworthy information. Our expert-authored content is rigorously fact-checked and sourced from credible authorities. Discover how we uphold the highest standards in providing you with reliable knowledge.
What are Candlestick Charts?
 Malcolm Tatum
Malcolm Tatum
Malcolm Tatum
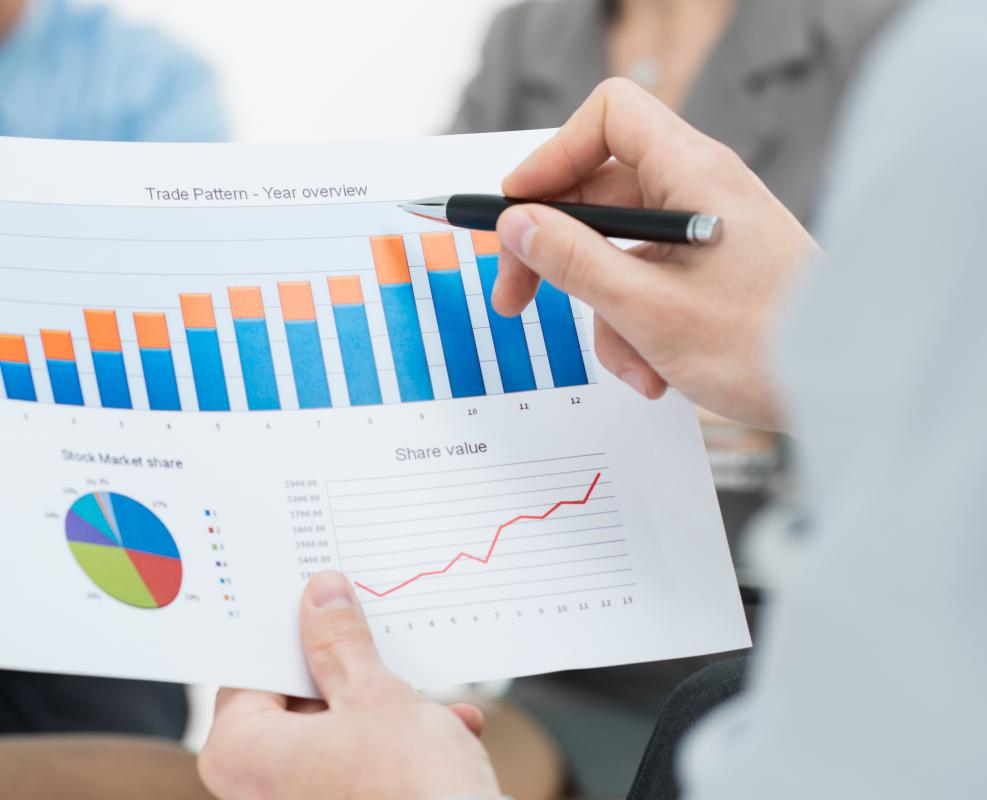
Sometimes referred to as bar charts or graphs, candlestick charts are one of the easiest forms of visual illustration when it comes to understanding the movements of a security over a specified period of time. Simplistic in design, the candlestick chart makes it easy for even the most inexperienced of investors to gain an understanding of the opening, high, low, and closing prices of any given investment opportunity.
Candlestick charts are generally understood to be a product of the 18th century. The credit for developing the charts is attributed to the Japanese trader Homma Munchisa. The idea was to gather all the technical analysis related to the activity of securities into one easy to read resource. The various movements on the chart create a design that appears to be a series of candles of different heights. At a glance, it is possible for the observer to grasp the upward and downward price movement of all sorts of stocks, bonds, commodities, and options. As a quick and easy tool to utilize in deciding to buy or sell a security, candlestick charts make it possible to review a great deal of information in one simple process.

By the beginning of the 20th century, candlestick charts had become a widespread investment tool in most countries. As electronic communications evolved, the process of creating candlestick charts became increasingly easy to accomplish. With the advent of the personal computer and software that can be used to create all sorts of graphs and charts from data entered into spreadsheets, the use of candlestick charts has grown even more prominent.

One of the innovations of newer versions of candlestick charts is the use of black and white bars or candles to designate the current market conditions impacting the prices. When the market is responding to circumstances that indicate a bullish market, the candle will be presented in white. For markets that appear to be exhibiting the qualities normally associated with a bear market, the candle is often depicted in black.
Malcolm Tatum
After many years in the teleconferencing industry, Michael decided to embrace his passion for trivia, research, and writing by becoming a full-time freelance writer. Since then, he has contributed articles to a variety of print and online publications, including WiseGEEK, and his work has also appeared in poetry collections, devotional anthologies, and several newspapers. Malcolm’s other interests include collecting vinyl records, minor league baseball, and cycling.
Learn more...
Malcolm Tatum
After many years in the teleconferencing industry, Michael decided to embrace his passion for trivia, research, and writing by becoming a full-time freelance writer. Since then, he has contributed articles to a variety of print and online publications, including WiseGEEK, and his work has also appeared in poetry collections, devotional anthologies, and several newspapers. Malcolm’s other interests include collecting vinyl records, minor league baseball, and cycling.
Learn more...AS FEATURED ON:
AS FEATURED ON:

-
![Candlesticks charts are often called bar charts.]() By: RidoCandlesticks charts are often called bar charts.
By: RidoCandlesticks charts are often called bar charts. -
![Candlestick charts date back to Japanese traders of the 18th century.]() By: beeboysCandlestick charts date back to Japanese traders of the 18th century.
By: beeboysCandlestick charts date back to Japanese traders of the 18th century.

Discuss this Article
Post your comments